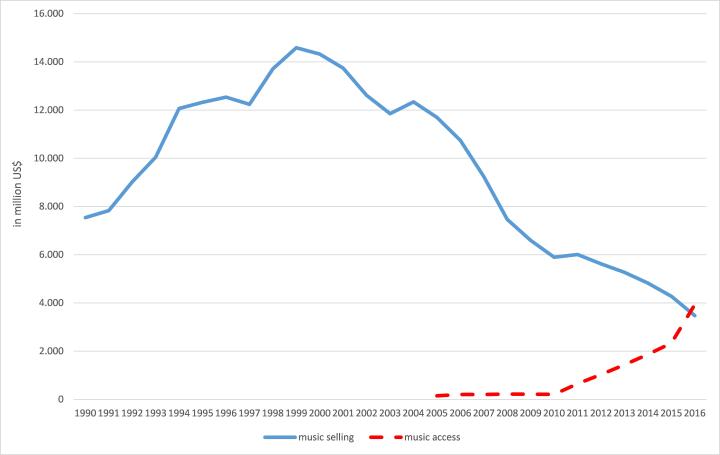
The Recording Industry Association of America (RIAA) recently published the shipment figures for recorded music in the US for 2016. The statistics highlight a tremendous shift from selling music (CDs and downloads) to accessing music (by streaming services). In the US, music consumers paid for the first time more for music access by ad-supported and paid streaming services (US$ 3.9bn) than for CDs, music downloads and ringtones (US$ 3.5bn).
Figure 1: Selling and accessing music in the US, 1990-2016
 Source: RIAA Year-End Industry Shipment and Revenue Statistics, reports 1990-2016
Thus, the US turned into a music streaming economy last year. It was a long way from a pure physical recorded music market in the 1990s to a yet digitized and music streaming driven market. The following blog entry identifies different periods of the US phonographic market and explains the driving forces of the change.
The US recorded music market in a long-term perspective, 1990-2016
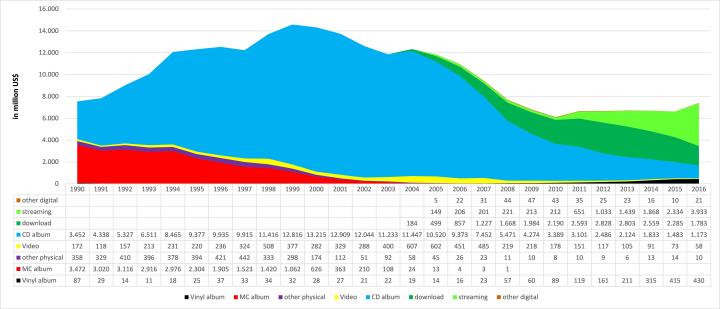
Fig. 2 highlights that the CD fuelled the sales boom in 1990s. Whereas in 1990 slightly more MC albums (US$ 3.47bn) were sold in the US than CD albums (US$ 3.45bn), the CD had become the single revenue source for the recorded music companies with shipments worth of US$ 13.2bn in 2000.
Figure 2: The US recorded music market, 1990-2016
Source: RIAA Year-End Industry Shipment and Revenue Statistics, reports 1990-2016
However, the millennium was the turning point for the recorded music business in the US. Within three years the market had lost 17.4 percent of its volume. These were years of disorientation and even panic. The recorded music companies feared that file-sharing turned music into a freely available good, which cannot be monetized. Thus, Apple’s iTunes download store seemed to be the knight in shining amour. First and foremost the record majors licensed their music catalogues to Steve Job’s empire and delivered the digital music market to Apple.
Despite a fierce war against file-sharing platforms and a growing music download market, the recession of the recorded music market accelerated. Combined physical and digital music sales decreased by 44.7 percent from US$ 11.9bn in 2003 to US$ 6.6bn in 2010.
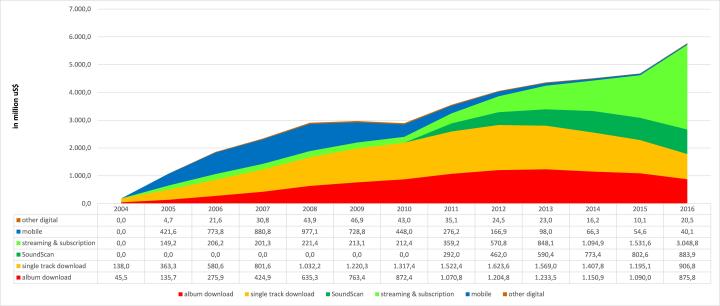
Before music downloads, however, began to dominate the digital music market, ringtones and ringback-tones drove the market growth. In 2007, the mobile market (US$ 880.8m) was even larger than the single track download segment (US$ 801.6m). In the following year mobile music sales peaked, but rapidly lost its economic relevance after 2009. However, music downloads stabilized the US recorded music market at a low level since 2010. In 2011, the digital music market (US$ 3.55bn) was the first time larger than the physical market (US$ 3.38bn). In 2011, the CD album segment had lost 76.5 percent of its volume compared to the historical peak in 2000.
Figure 3: The digital music market in the US, 2004-2016
Source: RIAA Year-End Industry Shipment and Revenue Statistics, reports 1990-2016
Although RIAA has reported revenues from music streaming since 2004, it was economically insignificant until 2011. In the same year RIAA added the SoundExchange distributions from non-interactive streaming services such as Pandora to the record labels for the first time. Thus, the combined revenue from SoundExchange and ad-supported & subscription music services triplicated from US$ 212.4m in 2010 to US$ 651.2m a year later. In the following years music streaming revenue was the main growth driver of the digital music market. Whereas single track download sales peaked at US$ 1.62bn in 2012 and digital album sales at US$ 1.23bn a year later, the average annual growth rate of music streaming revenue (incl. SoundExchange distributions) was 71.9 percent in the period from 2011-2015.
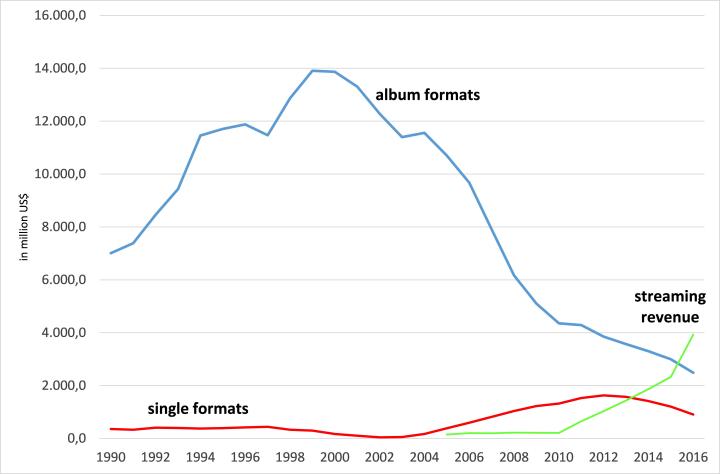
2016 is the pivotal year for the US recorded music market. After streaming revenue increased by 68.5 percent from US$ 2.33bn in 2015 to US$ 3.93bn in 2016, the US phonographic industry earned for the first time more from consumers accessing music than from purchasing music (fig. 1).
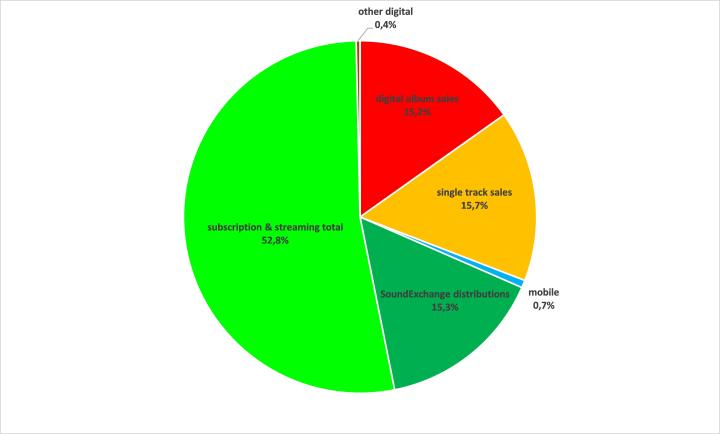
In 2016, subscription & ad-supported streaming generated 52.8 percent of the digital revenue. SoundExchange distributions from non-interactive streaming services (e.g. Pandora) and satellite radios (e.g. Sirius Satellite Radio) added a further share of 15.3 percent. Thus, music streaming has a digital market share of 68.1 percent compared to music downloads with a share of 30.9 percent and other digital formats (incl. mobile music) with 1.0 percent.
Figure 4: The digital music market in the US, 2016
Source: RIAA 2016 Year-End Industry Shipment and Revenue Statistics
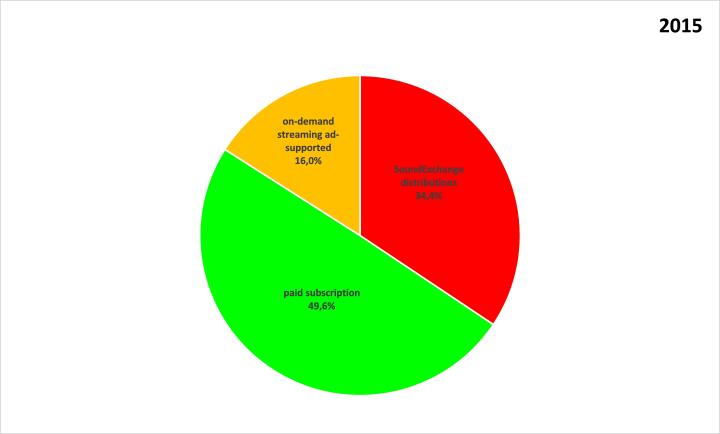
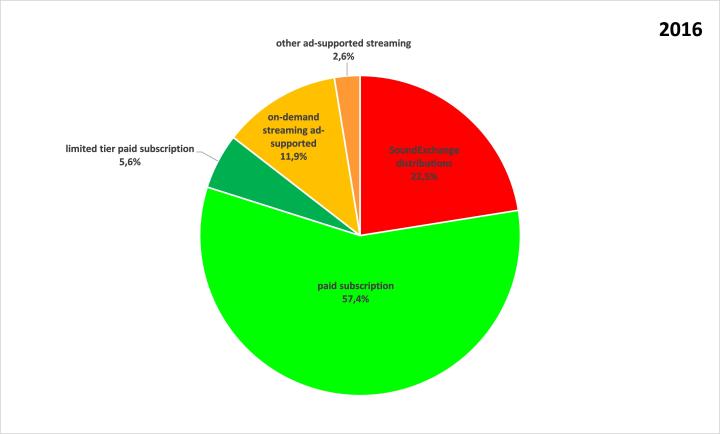
However, music streaming revenue comes from different sources. In current statistics, RIAA reports for the first time differentiated figures for paid subscription (e.g. Spotify, Apple Music), limited tier paid subscription (e.g. Spotify’s limited tier), ad-supported on-demand streaming (e.g. Spotify’s ad-supported tier) and other ad-supported streaming (e.g. YouTube) in addition to SoundExchange distributions (e.g. Pandora) for 2015 and 2016. A year-to-year comparison highlights a shift from ad-supported to paid streaming services. If we add SoundExchange distributions from more or less ad-based services such as Pandora to ad-supported streaming revenue, they accounted for slightly more than 50 percent of the overall streaming revenue in 2015. However, the market share of ad-supported streaming revenue shrank to 37 percent in 2016 despite a considerable growth by 23.7 percent from US$ 1.18bn (2015) to US$ 1.45bn (2016). In the same period, however, revenue from paid subscription increased by 113.9 percent from US$ 1.16bn to US$ 2.48bn.
Figure 5: The music streaming market in the US, 2015 and 2016
Source: RIAA 2015 and 2016 Year-End Industry Shipment and Revenue Statistics
This could be an evidence that US music consumers sustainably adopted music streaming subscriptions as the new mode of music consumption similar to Scandinavian countries such as Sweden. Thus, we can expect a further decline in CD and download sales in the next few years that will be compensated by increasing revenue from music streaming. And if the renaissance of vinyl continues, LPs will have a higher market share than CD albums in the foreseeable future, both constituting niche markets for audiophiles and collectors. The US, therefore, is on the way to a music streaming economy, in which accessing music anytime from everywhere rules music consumption behaviour. Thus, the traditional distinction between album and single formats will be obsolete in the near future, since music streaming does not rely on music formats anymore.
Figure 6: Music streaming revenue compared to singles’ and album sales in the US, 1990-2016
Source: RIAA Year-End Industry Shipment and Revenue Statistics, reports 1990-2016
Summary
Based on the RIAA recorded music sales statistics, we can identify the following periods in the recorded music market in the US:
1990-1999: The CD boom shaped the recorded music business and the CD replaced all other music formats on the market.
2000-2003: The CD sales peaked in the same year when music file-sharing disrupted the traditional recorded music business. In a transitional period from 2000-2003 recorded music sales in the US decreased by 17.4 percent until Apple opened its iTunes download shop.
2004-2009: After a temporary recovery of recorded music sales in 2004, the US market was hit by severe recession from 2005-2009 despite a booming mobile music segment and increasing download sales.
2010-2015: Music download sales stabilized the US recorded music market on a low level of about US$ 7bn. In 2010, music streaming generated for the first time a considerable revenue to boom in the following years.
2016 marks a new era. For the first time US music consumers spent more for accessing music (by music streaming services) than purchasing music (in digital and physical formats). Thus, the US recorded music business turned into a music streaming economy in which accessing music anytime from everywhere rules music consumption behaviour.
Sources
Recordings Industry Association of America, Year-End Industry Shipment and Revenue Statistics, reports 1990-2016
Hi Peter, thanks for you for sharing this post. I’m also working on this topic myself and I found it very insightful. I have also checked (https://www.riaa.com/u-s-sales-database/) and I notice you have created your own charts, how did you manage to get the raw data, is it possible to download it from their web or you had to do it manually from the reports? Many thanks!!!
Hi jcandela,
I’m glad that you find my blogpost insightful. However, I took a lot of time to collect and process the RIAA data. I did it all by myself with the RIAA raw data you mentioned.
I see. Thank you for letting me know. If at some point you decide to share that, it would be great.. thanks again for the post!!!